![]()
Performance analysis
This section is devoted to provide a comparison of the comorbidity analysis performance of Comorbidity4j with other similar software. In our analysis we considered evaluation datasets of different size in terms of number of patients, visits and number of diagnosis pairs to analyze for relevant comorbidities.
Datasets for performance comparison
We benchmarked Comorbidity4j by considering four different datasets of distinct sizes:
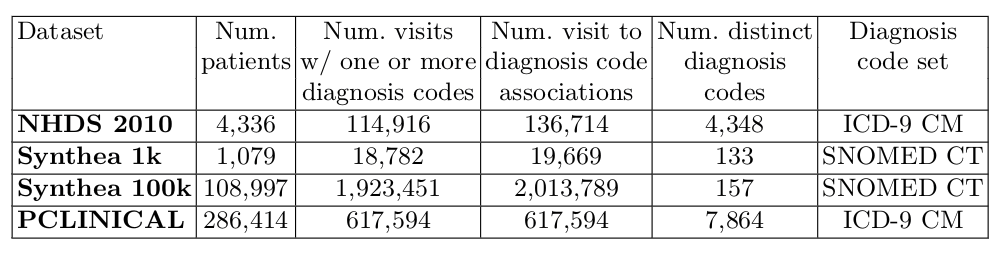
- NHDS 2010: includes information from the 2010 edition of the National Hospital Discharge Survey, a national probability survey designed to meet the need for information on characteristics of inpatients discharged from non-Federal short-stay hospitals in the United States. The 2010 edition of NHDS is the most recent one. The NHDS 2010 public dataset is available at ftp://ftp.cdc.gov/pub/Health_Statistics/NCHS/ (file: HDS10.PU.txt) as a single fixed-column-width-table. Diagnoses are described by means of ICD-9 CM diagnosis codes.
- Synthea 1k and Synthea 100k: two artifical clinical datasets describing respectively the clinical data of one thousand and one hundred thousand patients. Both datasets have been generated by Synthea, a Synthetic Patient Population Simulator Java tool (with its default settings). Approx. 20\% of visits generated by Synthea have a disease diagnosis. All the visits of this dataset have one or more SNOMED CT diagnosis codes associated.
- PCLINICAL: a proprietary real-data clinical dataset describing the diagnosis code timelines of the visits of hundred of thousand patients. To generate this dataset we have considered only visits with one or more ICD-9 CM diagnosis code and for each visit its primary diagnosis code.
The first three datasets are public ones (NHDS 2010, Synthea 1k and Synthea 100k). A version of these datasets that includes only the data needed for comorbidity analyses can be downloaded at http://comorbidity.eu/comorbiditydatasets/.
The following table summarizes relevant descriptive features of each benchmark dataset:
Results of performance comparison
We benchmarked Comorbidity4j against comoRbidity [1], a publicly available R tool that supports comorbidity analyses of clinical data.
The following table shows the results of the comparison of Comorbidity4j (C4J) with comoRbidity (comoR) with respect to the four clinical dataset previously introduced. In particular, the third column specifies if we took into account (YES, 14 days) or not (NO) diagnosis directionality in the comorbidity analysis. If directionality is considered, two diagnosis of diseases should be interleaved by 14 days or more to be considered in the analysis of comorbidities. The last column provides an estimation of the peak RAM required during the data analysis: this value should be considered as an estimation since could be affected by several non deterministic factors.
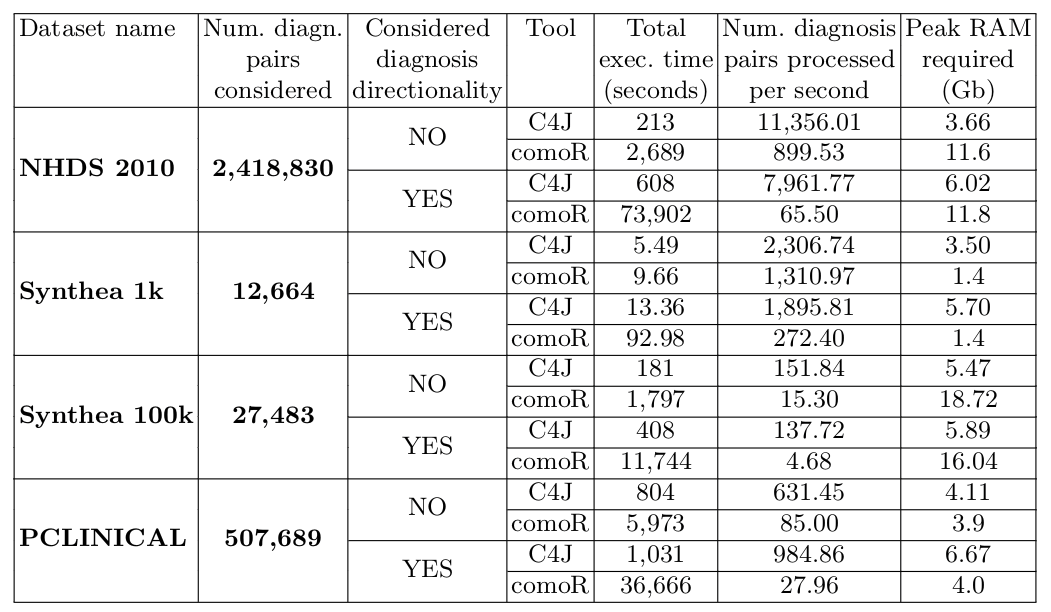
We can notice that, with respect to the data analysis speed (measured in terms of execution time and number of diagnosis pairs processed per second), Comorbidity4j obtains better performance with any benchmark dataset. Such improvement in performance becomes particularly significant when: (i) the size of the input dataset grows in terms of patients, visits and diagnoses; (ii) the number of candidate diagnosis pairs to check for comorbidity increases; (iii) diagnosis directionality is considered.
In general, when we consider big clinical dataset, Comorbidity4j manages to divide the execution times of comorbidity analyses by at last one order of magnitude.
Bibliography
[1] Gutiérrez-Sacristán, A., Bravo, À., Giannoula, A., Mayer, M. A., Sanz, F., & Furlong, L. I. (2018). comoRbidity: an R package for the systematic analysis of disease comorbidities. Bioinformatics, 34(18), 3228-3230.