![]()
Comorbidity scores
Comorbidity4j estimates several measures to determine if two diseases are comorbid in the population under study: Risk Ratio (RR), Odds Ratio (OR), Comorbidity score (CS), Phi value (PHI). In addition, a Fisher exact test can be applied to determine the significance of the associations.
Risk Ratio (RR)
Relative risk or Risk Ratio (RR) The Relative Risk or Risk Ratio (RR) expresses the relationship between disease A and disease B as a ratio measure of effect (or risk) on the disease prevalence. If we consider that disease A is the outcome variable and disease B the exposure variable, we can ask if a diagnosis of disease B increases the risk of having a diagnosis of disease A. In other words, if disease A co-occurs with disease B more frequently than expected as if they were independent in this population.
The RR is estimated as the fraction between the number of patients diagnosed with both diseases and random expectation based on disease prevalence, as described in [1]:
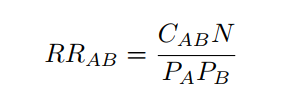
where CAB is the number of patients diagnosed with both diseases, N is the total number of patients in the population and PA and PB are the prevalences of diseases A and B.
The RR can take the following values:
- RR = 1: Disease A and disease B are independent regarding prevalence.
- RR > 1: Disease A and disease B co-occur more often than expected by chance.
- RR < 1: Disease A and disease B co-occur less often than expected by chance.
Odds Ratio (OR)
The odds ratio represents the increased chance that someone suffering disease A will have the comorbid disorder B. It shows the extent to which suffering a disorder increases the risk of developing another illness or disorder. The odds ratio is derived from a comparison of rates of the illness among individuals who do and do not exhibit the factor of interest. A statistically significant odds ratio (significantly different from 1.00 at the .05 level) indicates an appreciable risk associated with a particular factor. For example, an odds ratio of 2.00 indicates a doubled risk of the appearance of the disorder.
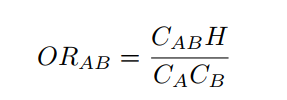
where CAB is the number of patients diagnosed with both diseases, H is the number of patients without any of the diseases and CA and CB are the number of patients diagnosed with diseases A and B respectively.
Comorbidity score (CS)
This score is defined in Roque et al. as follows [2]:
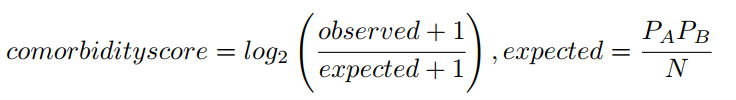
where observed stands for the number of patients diagnosed with both diseases (disease A and disease B), and expected is estimated based on the prevalence of each disease (prevalence of disease A, PA, multiplied by the prevalence of disease B, PB, and divided by the total number of patients, N ). A pseudocount of 1 is added to correct bias of the Comorbidity score towards low prevalent diseases.
Since the logarithm is applied, a comorbidity score of 1.0 means that the observed comorbidities are higher than two fold (approximately) than expected.
Phi value (PHI)
Phi value (Pearsons correlation for binary variables) measures the robustness of the comorbidity association. It can be expressed mathematically as:
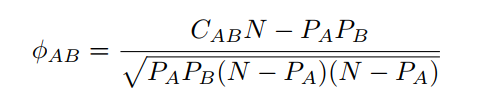
where N is the total number of patients in the population, PA i and PB are prevalences of diseases A and B respectively. CAB is the number of patients that have been diagnosed with both diseases A and B, and PA PB is the random expectation based on disease prevalence.
The Pearson correlation coefficient, can take a range of values from +1 to -1:
- φAB = 0: indicates that there is no correlation between the two diseases.
- φAB > 0: indicates a positive correlation between the two diseases.
- φAB < 0: indicates a negative correlation.
Fisher exact test
A Fisher exact test for each pair of diseases is performed to assess the null hypothesis of independence between the two diseases. Four groups of patients are defined in order to perform the statistical testing: patients diagnosed with disease A and disease B, patients diagnosed with disease A but not disease B, patients diagnosed with disease B but not disease A and patients not diagnosed with disease A nor disease B. The Fisher exact test is then applied to estimate the p-value for each pair of diseases. The Benjamini-Hochberg false discovery rate method [3] is applied on the ranked list to correct for multiple testing.
Comorbidity4j compute also adjusted Fisher exact test p-values by giving the users the possibility to choose among one of the following adjustment approaches: BONFERRONI, BENJAMINI_HOCHBERG, HOLM, HOCHBERG, BENJAMINI_YEKUTIELI, HOMMEL. The p-value adjustment approach to consider can be specified by Comorbidity4j users by means of a specific parameter of the property file (see Comorbidity analysis parameters). To get more information about the p-value adjustment approaches available in Comorbidity4j, please refer to the documentation of the R method p.adjust.
Sex ratio
In addition to the comorbidity scores previously described, Comorbidity4j computes also the sex ratio of each pair of diseases considered for comorbidity analysis. The formula used to compute sex ratio [4] is:
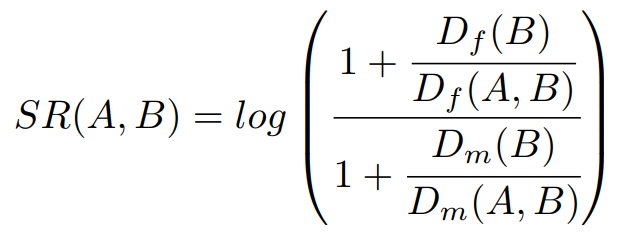
where Df(B) stands for the number of female patients suffering disease B, while Dm(B) points out the number of male patients suffering disease B. Df(A,B) denotes those female patients suffering disease B who also have been diagnosed with a disease A, while Dm(A,B) denotes those male patients suffering disease B who also have been diagnosed with a disease A.
SR values close to 0 mean that the comorbidity is equally likely for females and males. Positive SR values indicate that the comorbidity is more likely for females, while negative SR values indicate that the comorbidity is more likely in males. Thus if SR has a positive values the diagnosis of disease A in patients that have been diagnosed with disease B is more likely in femeles than males.
References
[1] Hidalgo C, Blumm N, Barabasi A, Christakis N A Dynamic Network Approach for the Study of Human Phenotypes PLoS Computational Biology 2009 vol: 5 (4) pp: e1000353
[2] Roque, Francisco S and Jensen, Peter B and Schmock, Henriette and Dalgaard, Marlene and Andreatta, Massimo and Hansen, Thomas and Soeby, Karen and Bredkjaer, Soren and Juul, Anders and Werge, Thomas and others Using Electronic Patient Records to Discover Disease Correlations and Stratify Patient Cohorts PLOS Computational Biology 2011 doi:10.1371/journal.pcbi.1002141
[3] Yoav Benjaminia; Dan Draib; Greg Elmerc; Neri Kafkafid; Ilan Golanib Controlling the false discovery rate in behavior genetics research Behavioural Brain Research 2001 doi:10.1016/S0166-4328(01)00297-2
[4] Klimek, P., Kautzky-Willer, A., Chmiel, A., Schiller-Frühwirth, I., & Thurner, S. (2015). Quantification of diabetes comorbidity risks across life using nation-wide big claims data. PLoS computational biology, 11(4), e1004125.